
1.Introduction
The Dynamic Weather is part of the full Dynamic Elements bundle and allows you to show real-time weather information and weather forecasts of any location in the world on your Microsoft PowerPoint slideshow.
2.System Requirements
Microsoft Office 2016 and up.
.NET Framework 4.7.2 and up. Read full specifications here.
Supported Client Operating Systems:
- Windows 10
- Windows 11
Supported Server Operating Systems:
- Windows Server 2012
- Windows Server 2016
- Windows Server 2019
- Windows Server 2022
- Windows Server 2023
3.Getting Started
Start by unzipping the ZIP file and you will get this file.
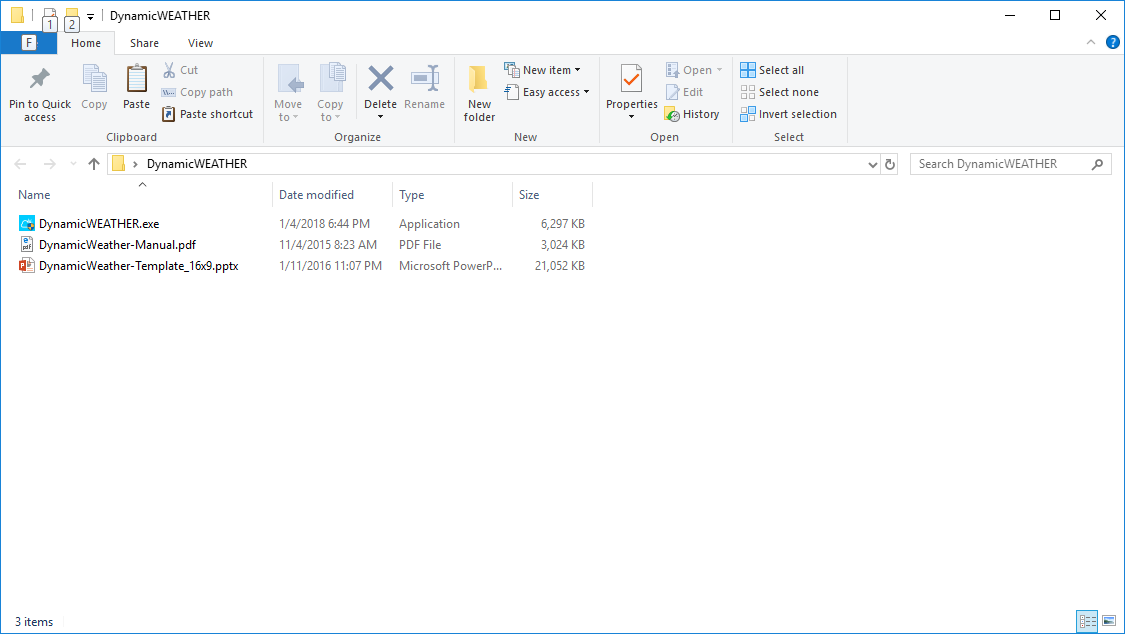
The DynamicWeather.exe is the installation setup and is best executed by a user with administrative rights. After installation, you will see a new Dynamic Elements menu item in the PowerPoint ribbon.
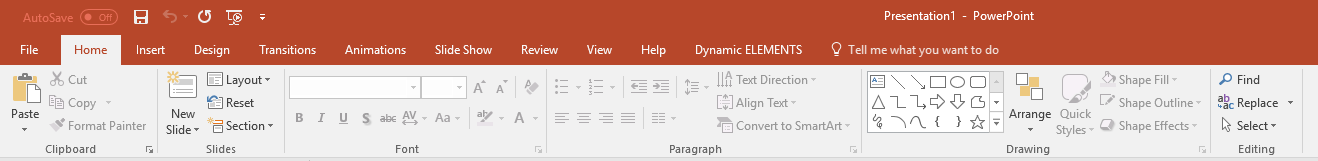
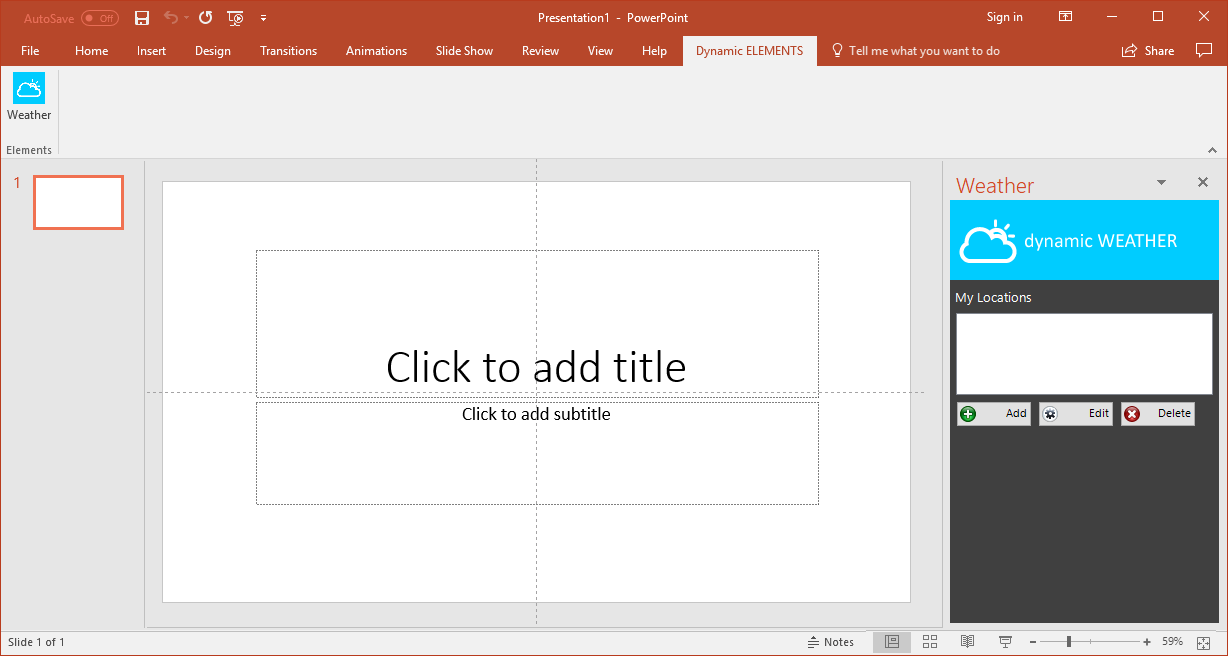
When you click to open this Dynamic Elements menu option, then you will see the Dynamic Weather button in the group.
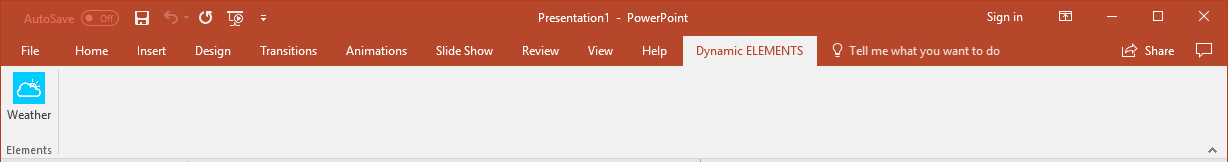
In the event that you have more add-ons of the Dynamic Elements bundle installed, then more buttons will show up here.
Click the Weather button to open the Dynamic Weather pane in PowerPoint.
4.Adding Locations
You can choose to display the real-time weather information of your city or your location only. Or you can choose to display a real weather report for your state, province or country.
Basically, just add one or multiple locations to your presentation and start displaying its information.
With the Dynamic Weather pane open, see the My Locations list.
Click the Add button and this form will appear.
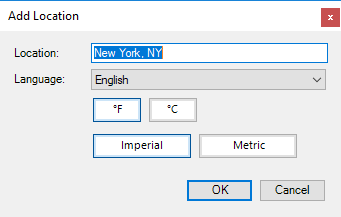
Change the name of the city to your desired location. Always best is to use the name of the city and the code or the state, the full name of the state, or the name of the country. Select the language for the weather descriptions. Choose to display the weather units in Fahrenheit or Celsius, and for measurements choose between Imperial or Metric. And hit OK to close.
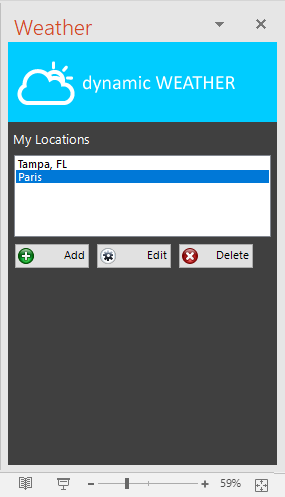
You can choose to add more locations, edit existing ones or drop certain locations from the list.
Dynamic Weather will refresh its information every 30 minutes while the slideshow is running.
5.Using Text Boxes
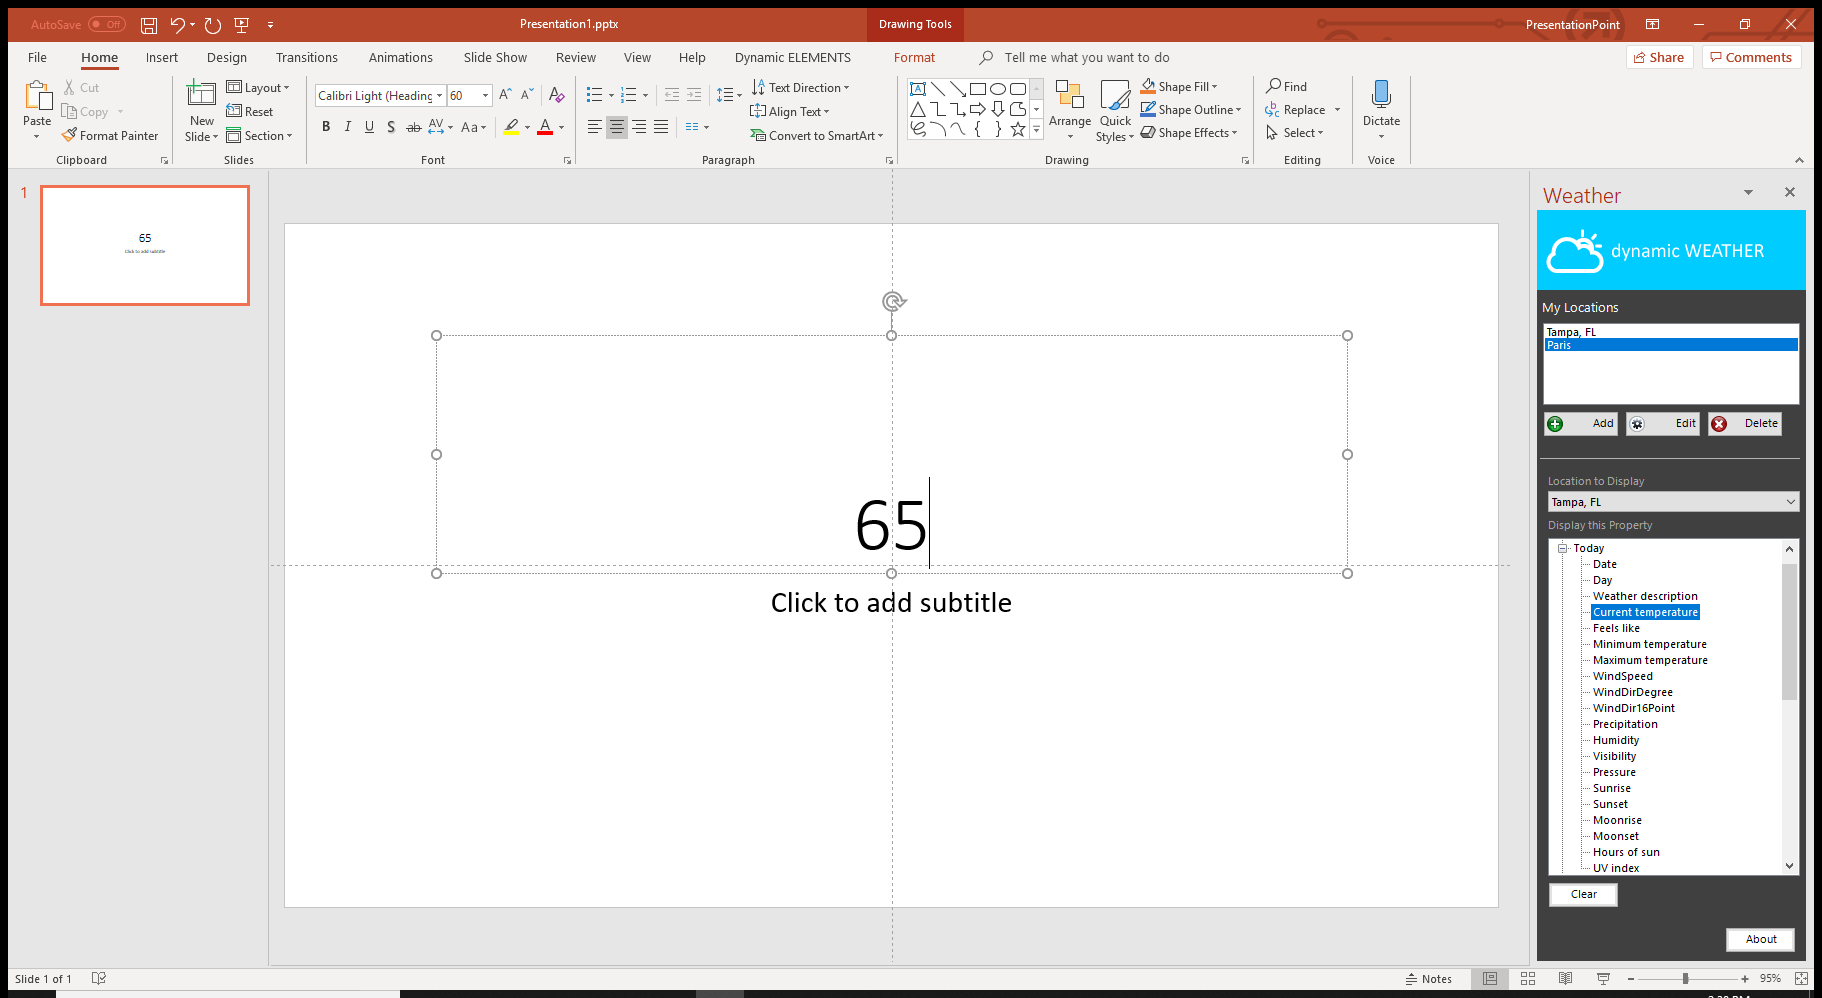
Select a text box and more weather options are displayed at the weather pane.
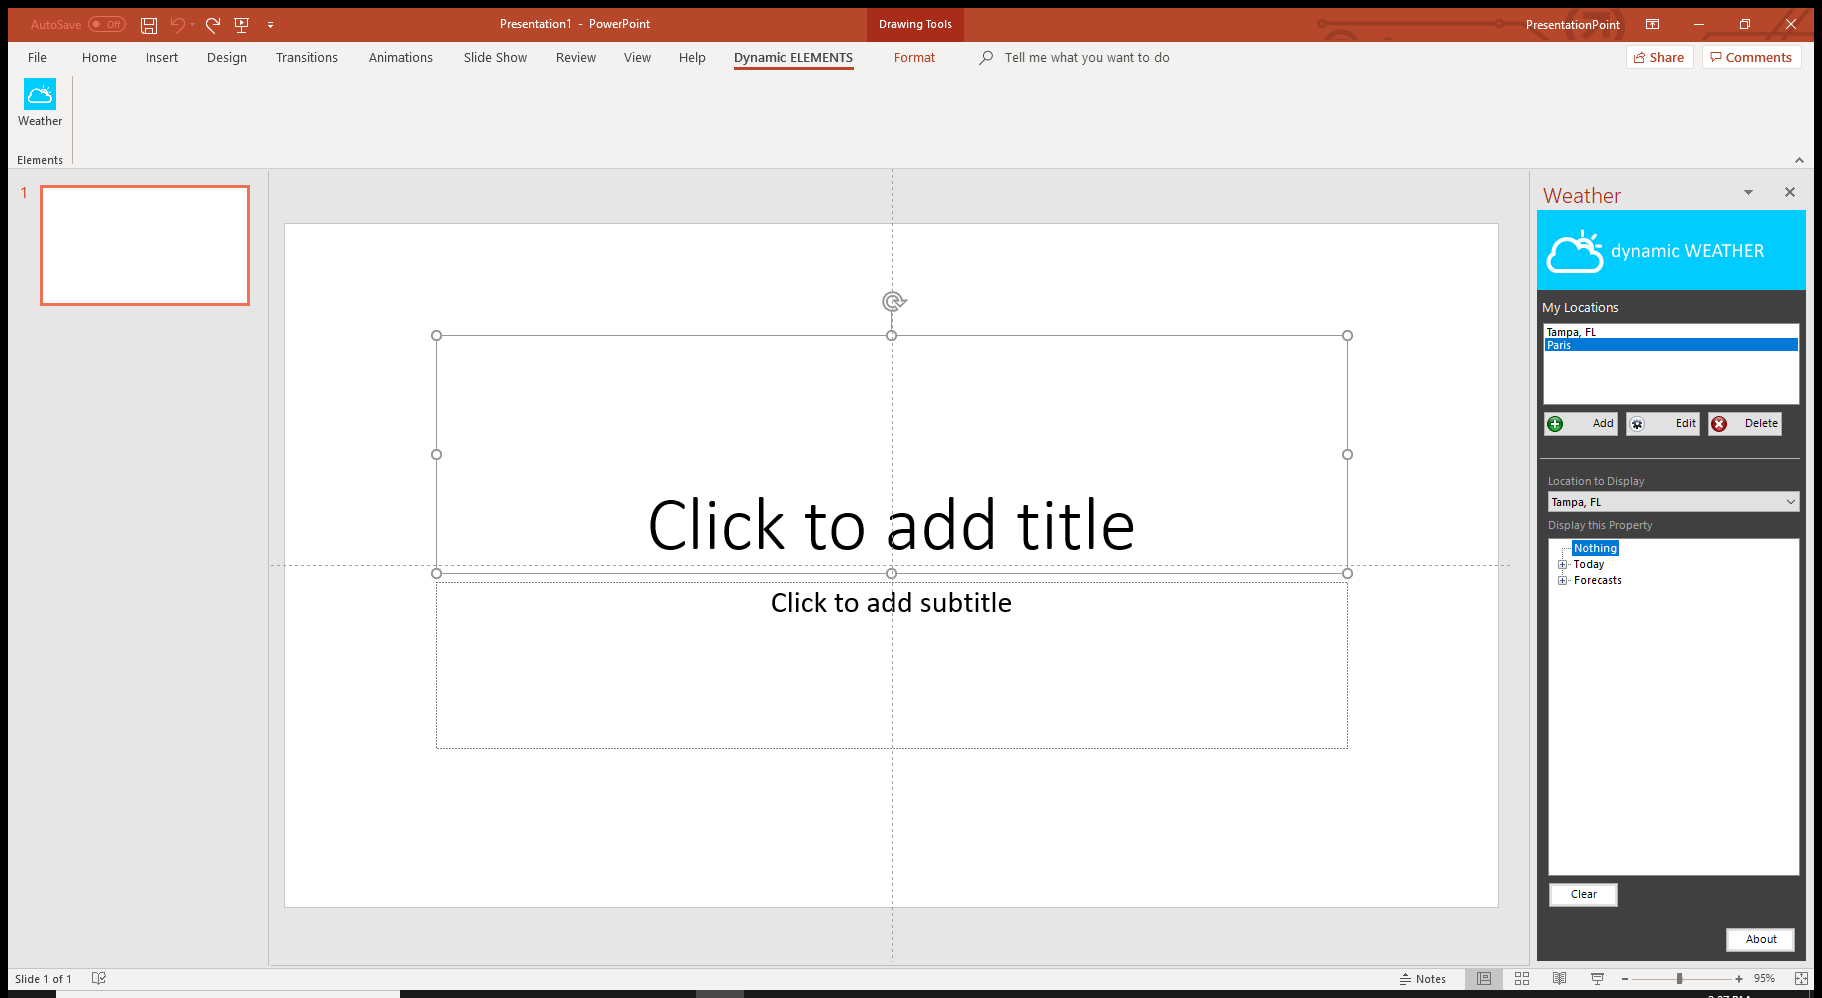
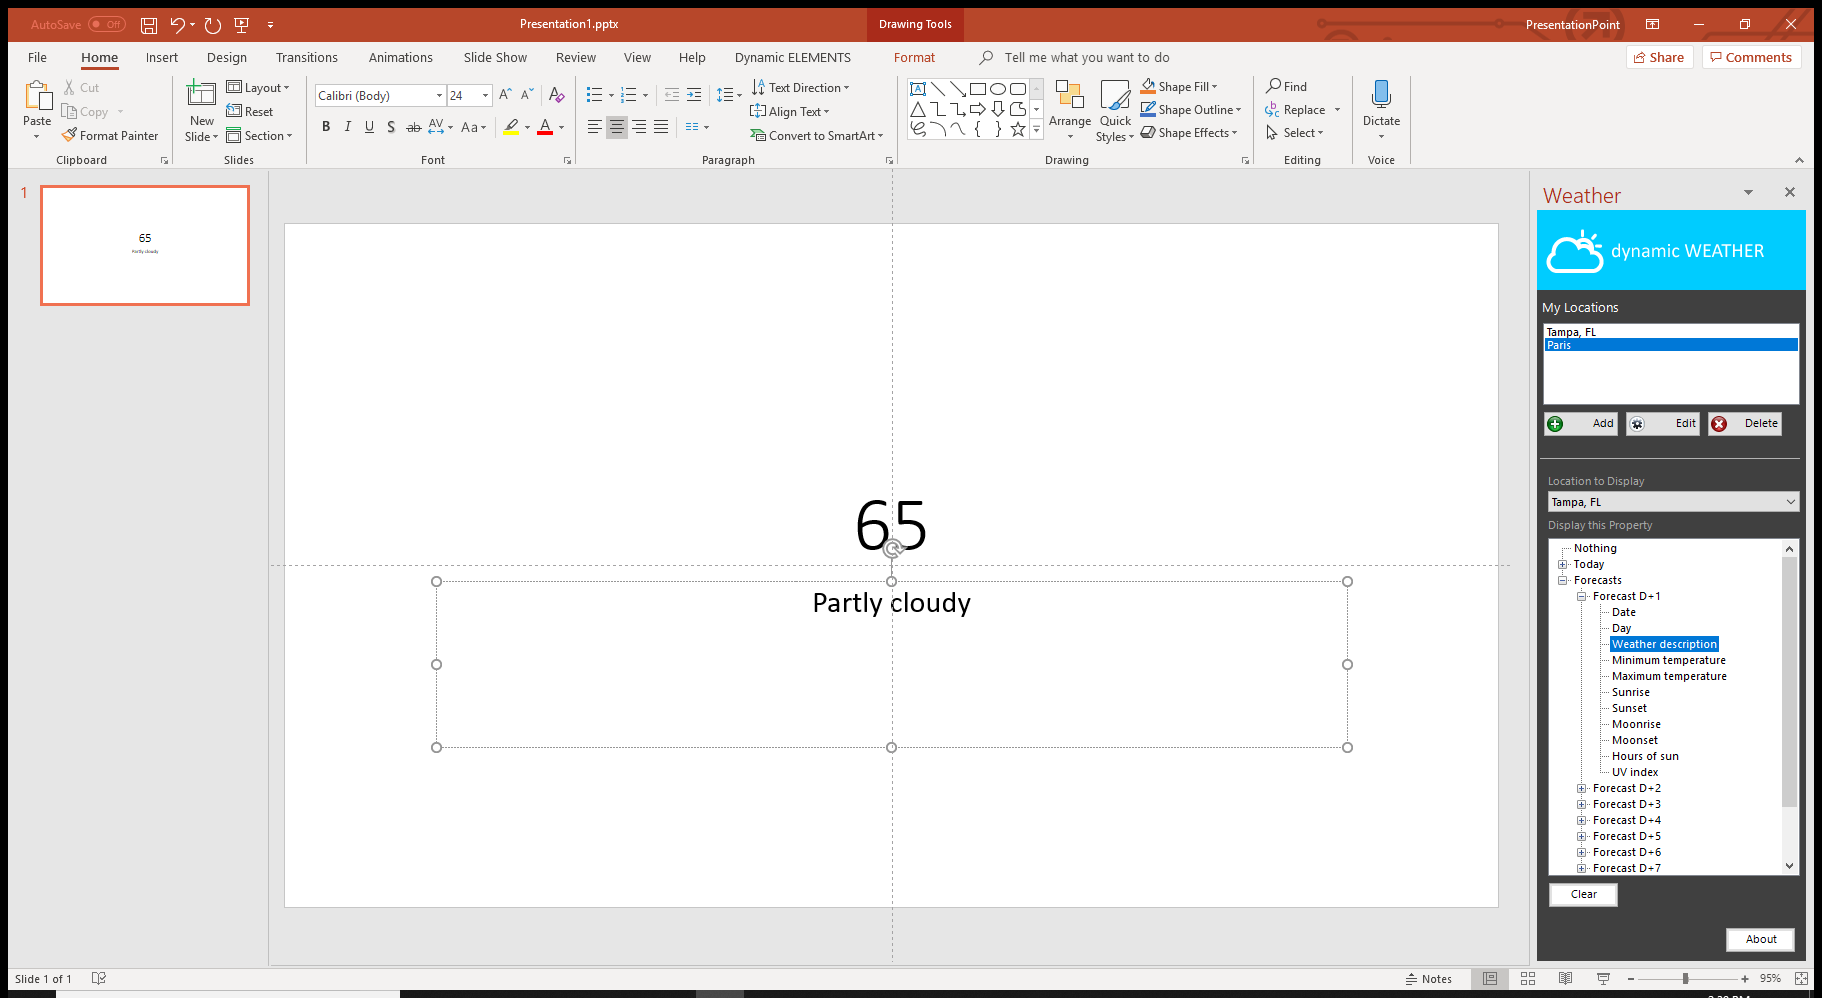
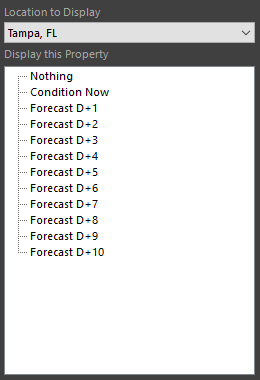
First, select the location for which you want to retrieve the information from. Then you can choose to display a weather property. All weather properties are grouped under Today and Forecasts.
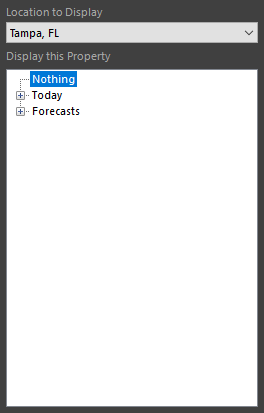
To display a weather property of today, select the node named Today and double click or click the plus sign, to open all of its properties.
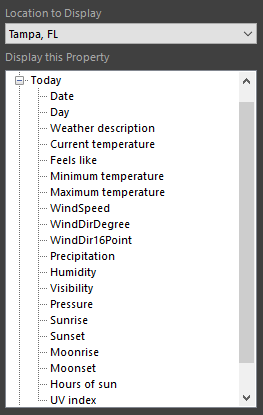
For today’s weather, you can choose for example to display current, minimum and maximum temperature, and much more like sunrise, sunset, the date of today and the weather condition in written text like Sunny.
Select a given weather property and its value will be dynamically linked to the text box. Select e.g. current temperature. The value will be placed at the text box that was selected before we started this.
To display the weather forecast for the next coming days, select another text box and click to open the forecasts group of the weather properties. There you will find the forecasts of the next 10 days. Click e.g. to open Forecast D+1. This corresponds to the forecast of tomorrow.
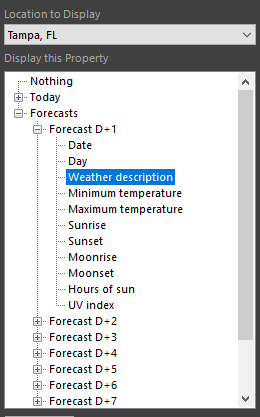
Select the Weather Description weather property and its value will be copied to the text box.
We are not going to discuss all the weather properties in detail. It is probably clear for everyone what type of information can be found here. Go thru the list of properties and see what all is inside a weather feed. All these properties can be linked to your text boxes.
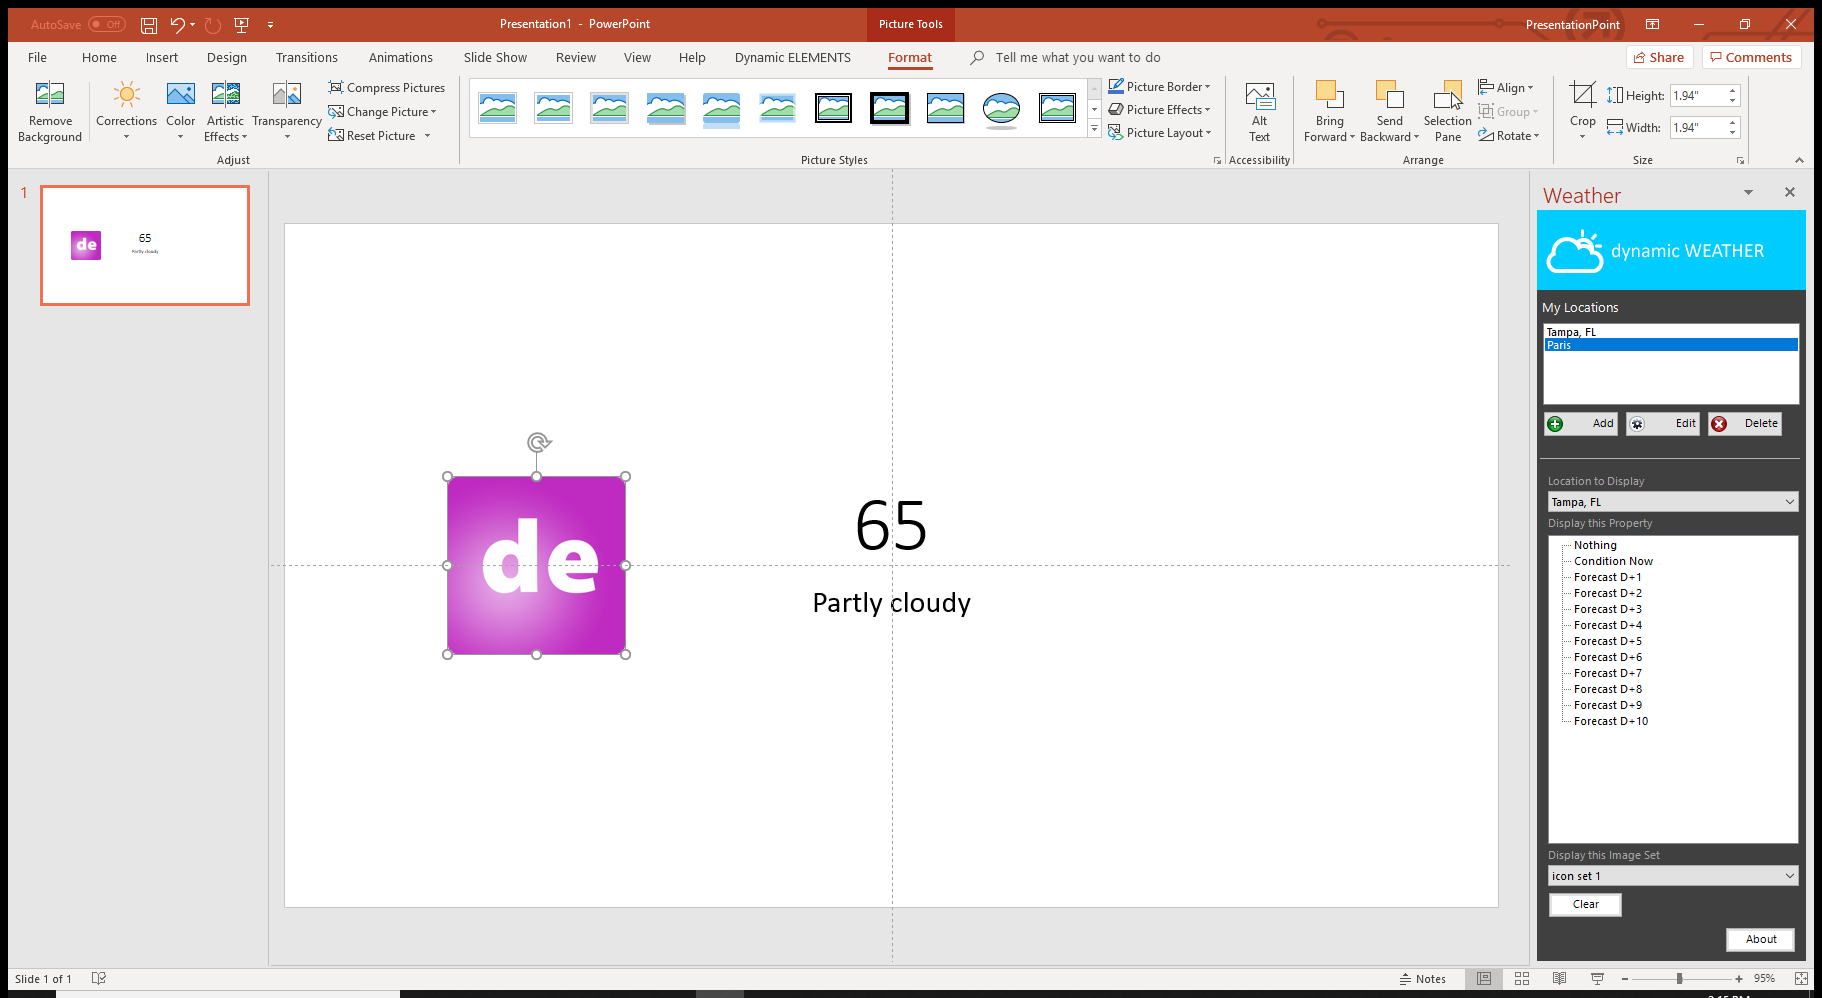
6.Using Weather Icons
A weather map without weather icons is nothing. With Dynamic Weather you can show weather icons as well, next to textual information.
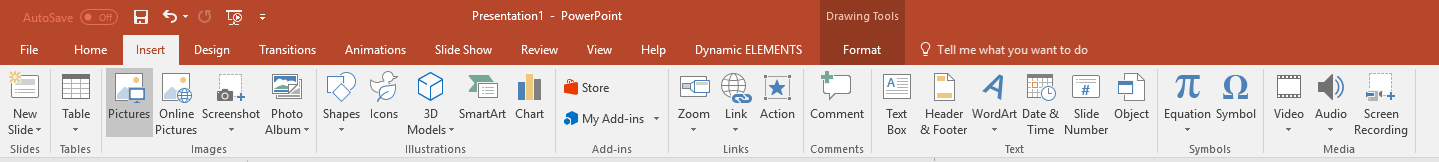
Insert a new picture first. It doesn’t matter what content it has as it will be replaced soon. Click to open the Insert menu and click the Pictures button.
Browse for any dummy image.
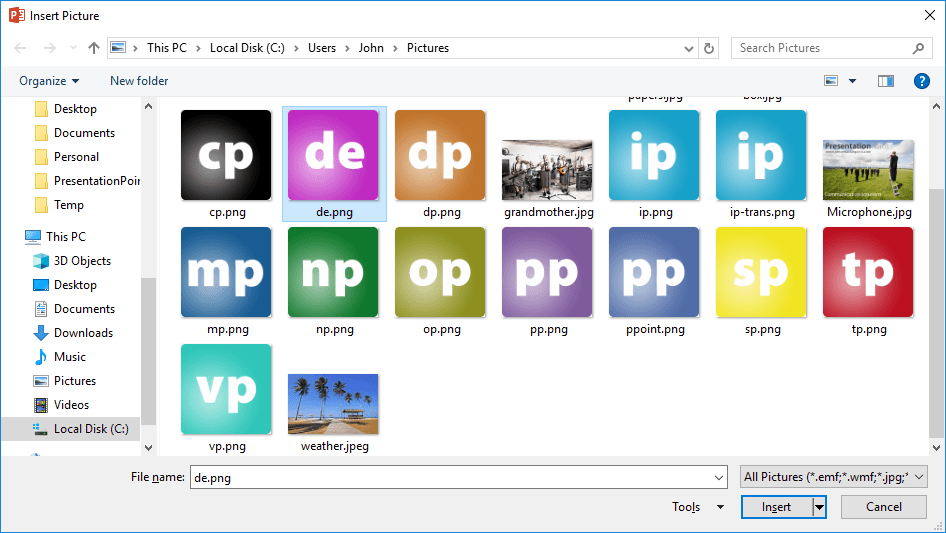
Select the image and insert it onto the slide.
Resize and place the image where you want to see it.
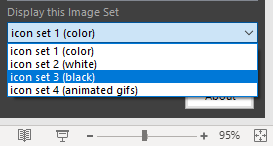
Dynamic Weather is shipped with 4 weather icon sets.
- A normal icon set with colored icons
- An icon set with white icons
- An icon set with all black icons
- And finally an icon set with nice animated gifs, or videos so to say.
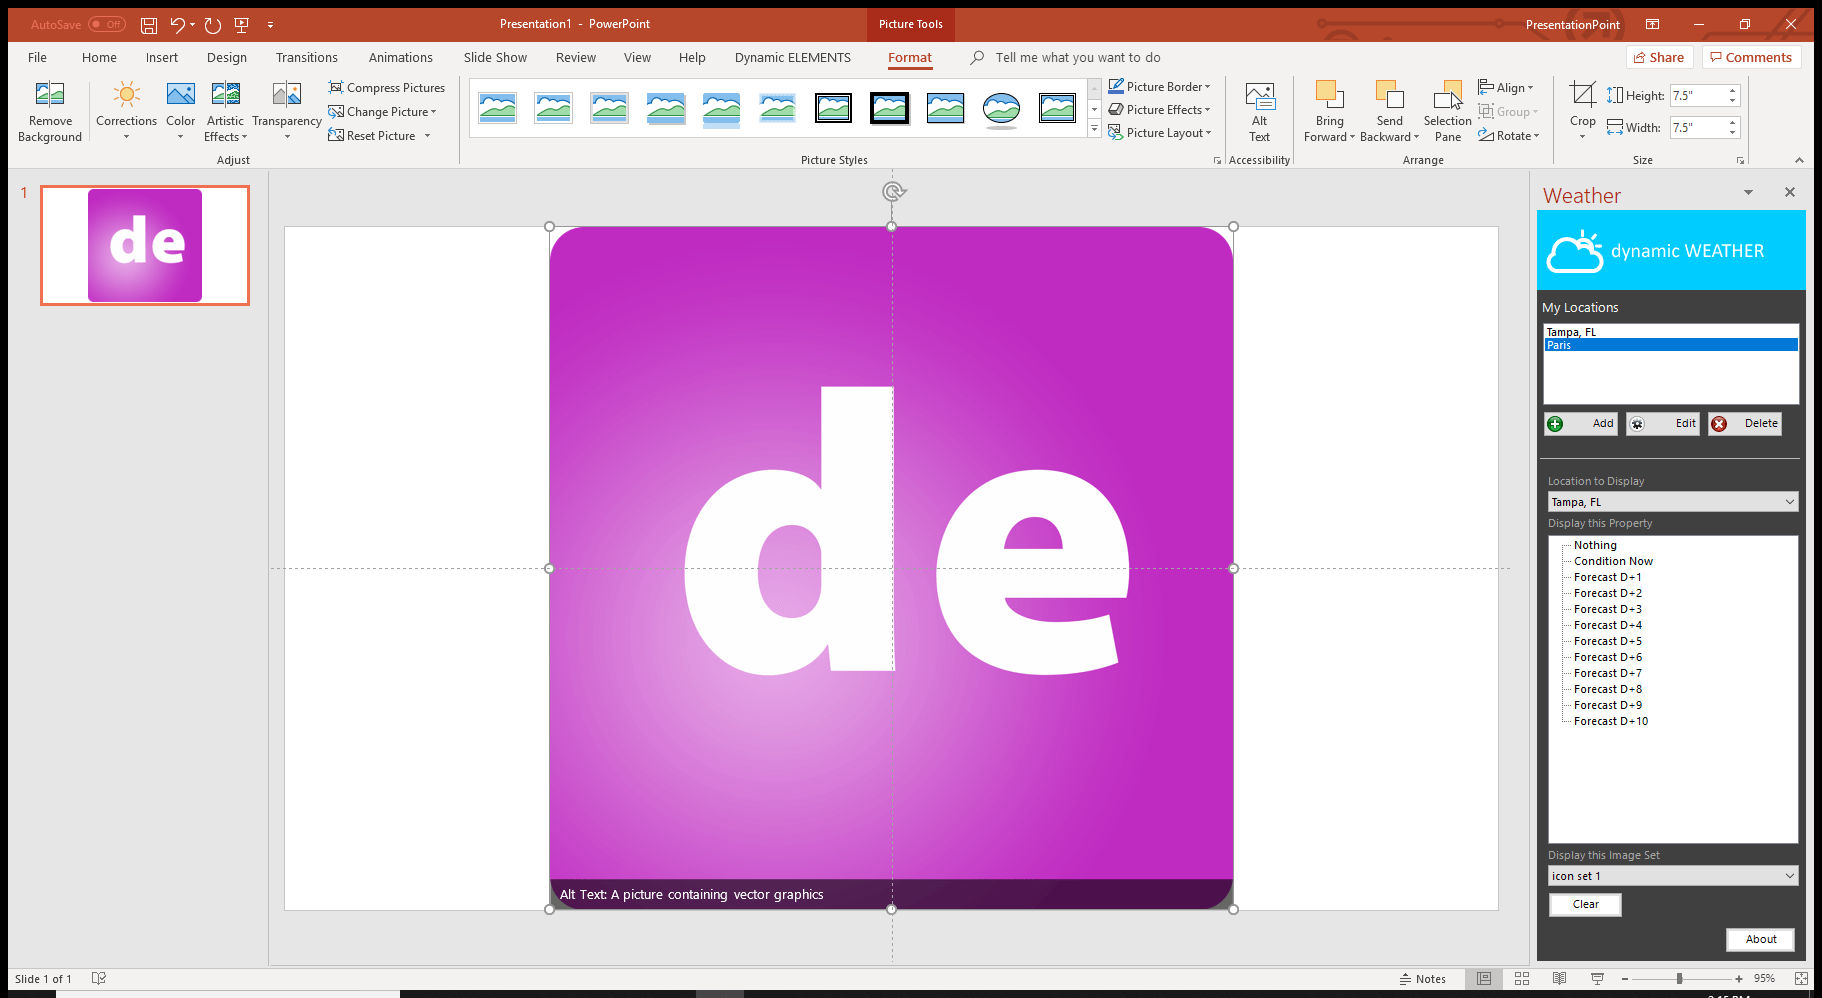
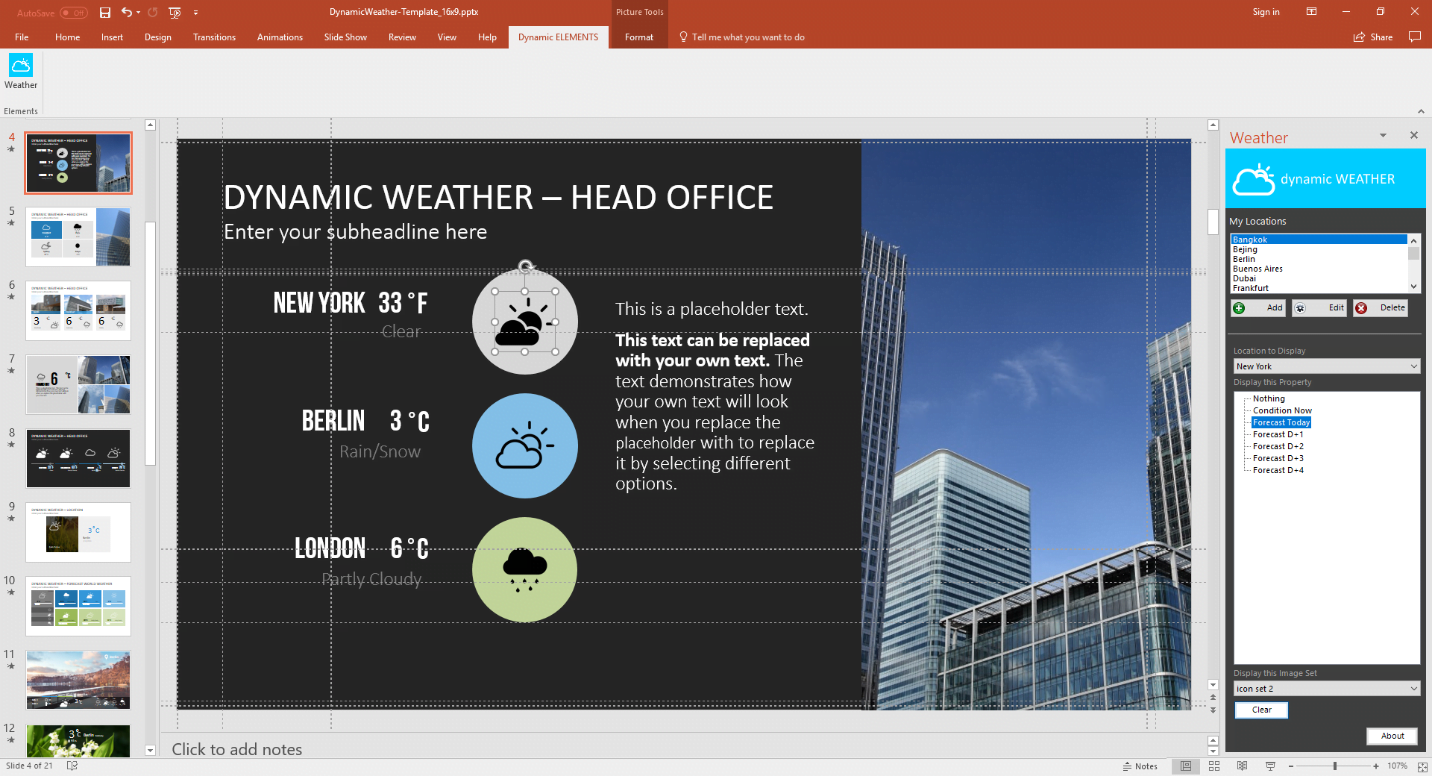
Select the image again and from the pane at the right, choose first the location that you want to use here.
After you select the location, select whether you want to display the weather icon of the current condition, the icon today’s forecast, or the weather icons for the next forecasted days. Based on this selection, Dynamic Weather will update and replace the picture’s content accordingly.
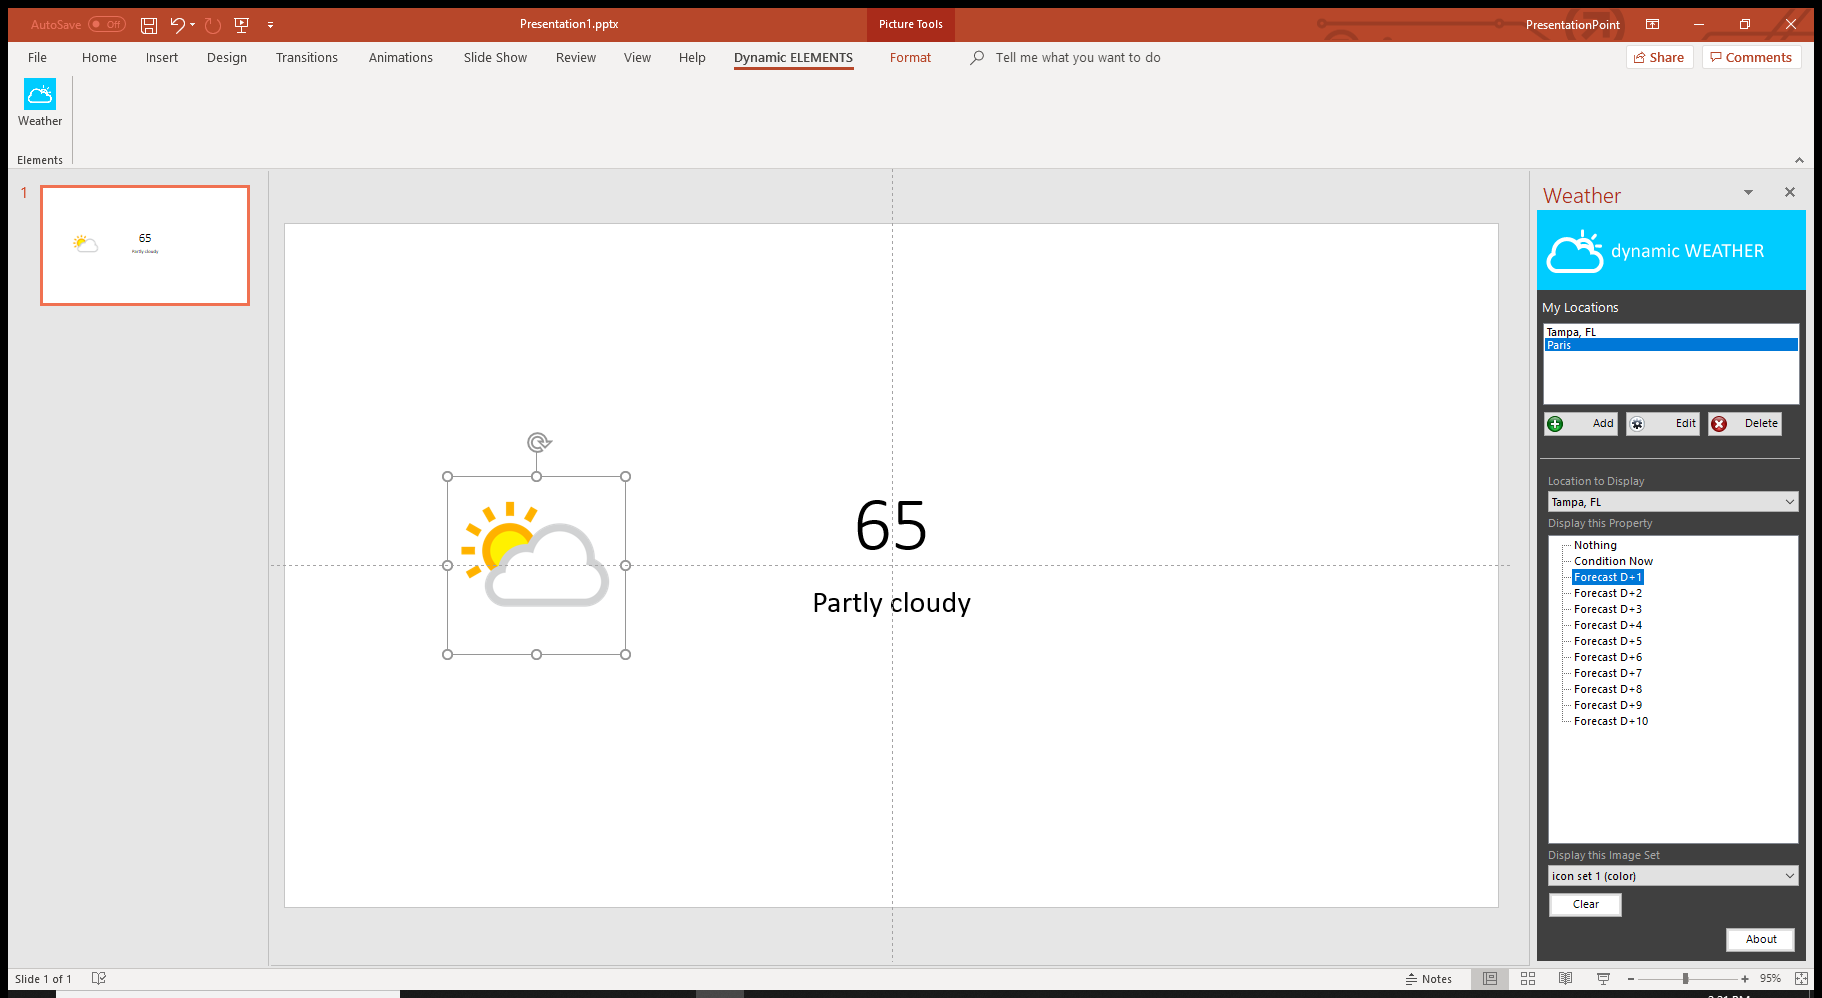
Look at the bottom of the weather pane. There you can switch between weather icon sets.
Run your slide show now and Dynamic Weather will update your weather content automatically every 30 minutes.
7.Use a Custom Weather Icon Set
There are 4 weather icon sets shipped with the Dynamic Weather add-on. A colored one, a white one, a black one and one set with animated gifs. You can design and add your own weather icon set, maybe in the company colors. Or maybe a completely different design.
Go to the location where the Dynamic Weather icons are installed. By default, this is C:\Program Files (x86)\Dynamic Elements\Dynamic WEATHER\weather icons
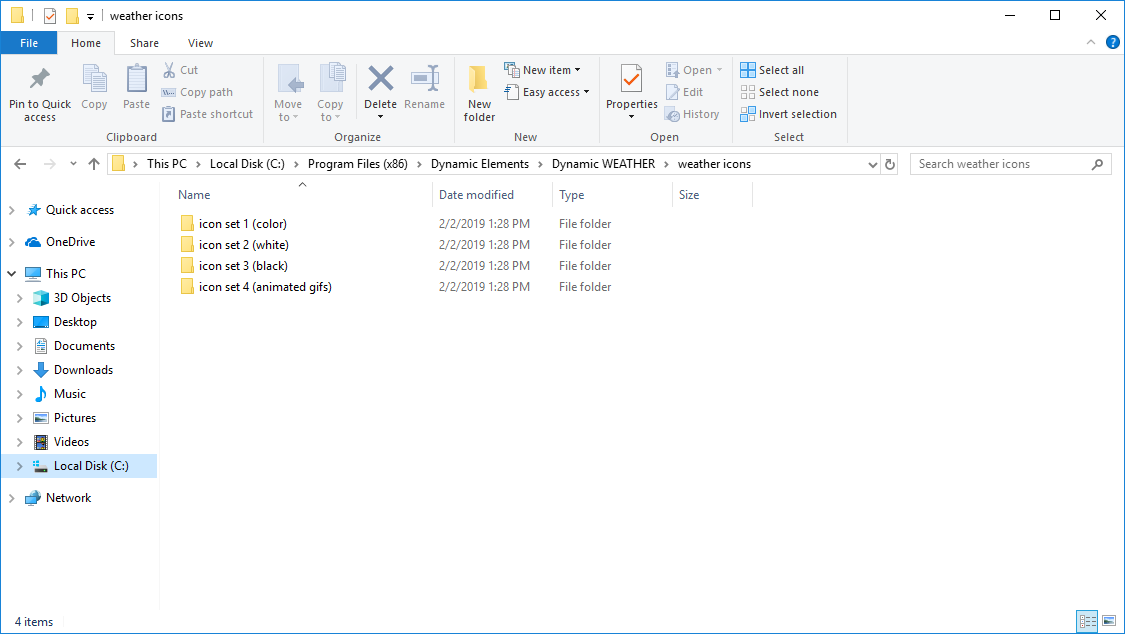
In here, you will find the 4 standard weather icons sets.
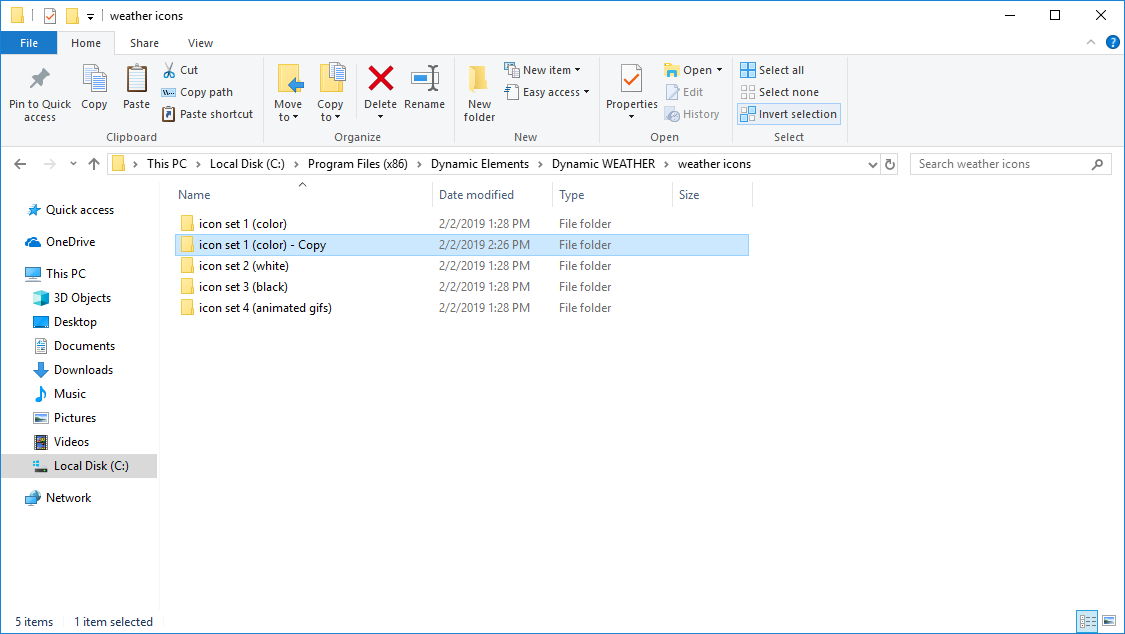
Just duplicate a folder.
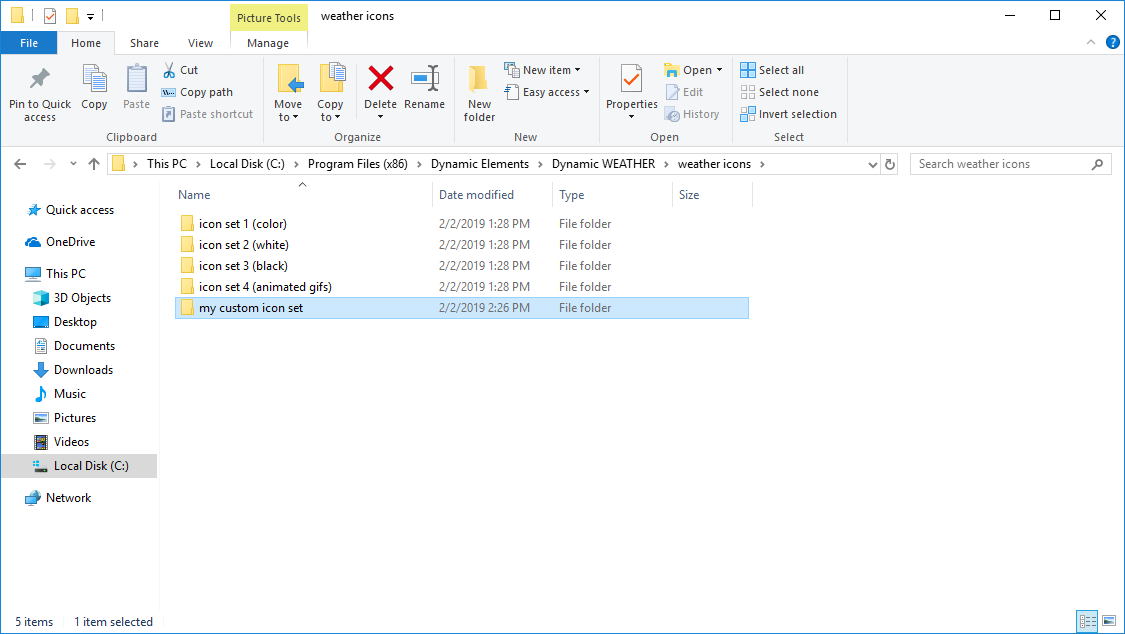
And rename the folder.
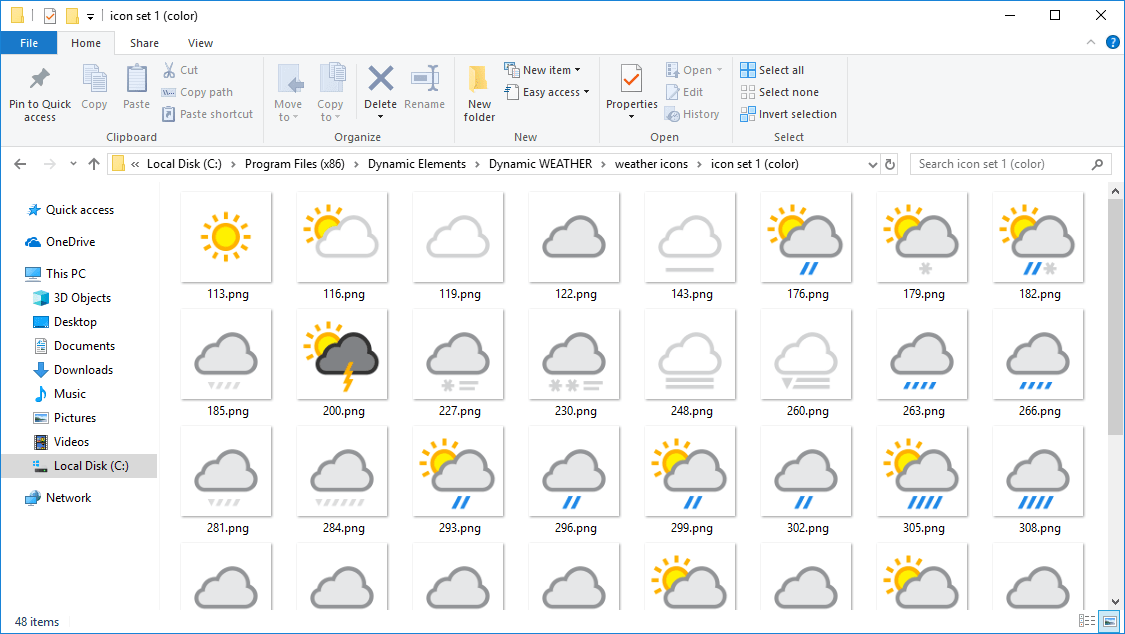
Open the folder and you will find a weather icon per weather type possible. Open and edit, or completely replace the content with your design or colors.
When done, restart your PowerPoint application and you will be able to choose between 5 weather icon sets now.
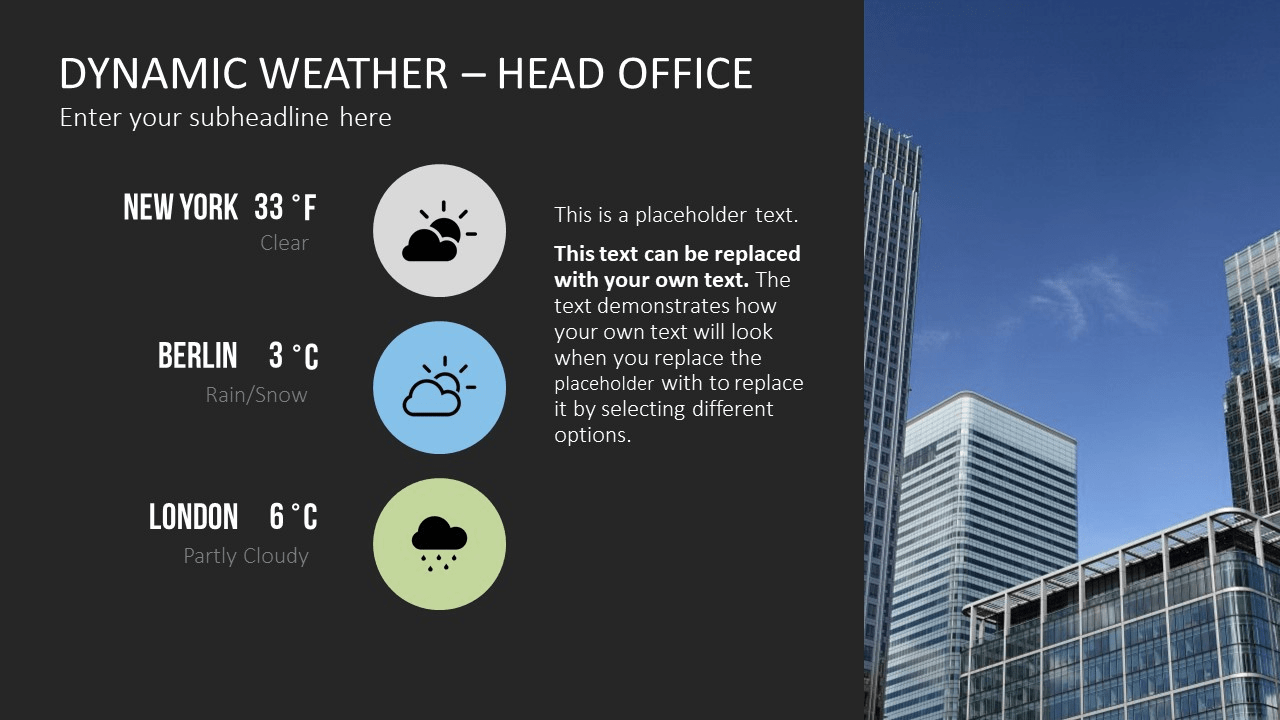
8.Using the Template
Open the accompanying template and start showing off immediately.
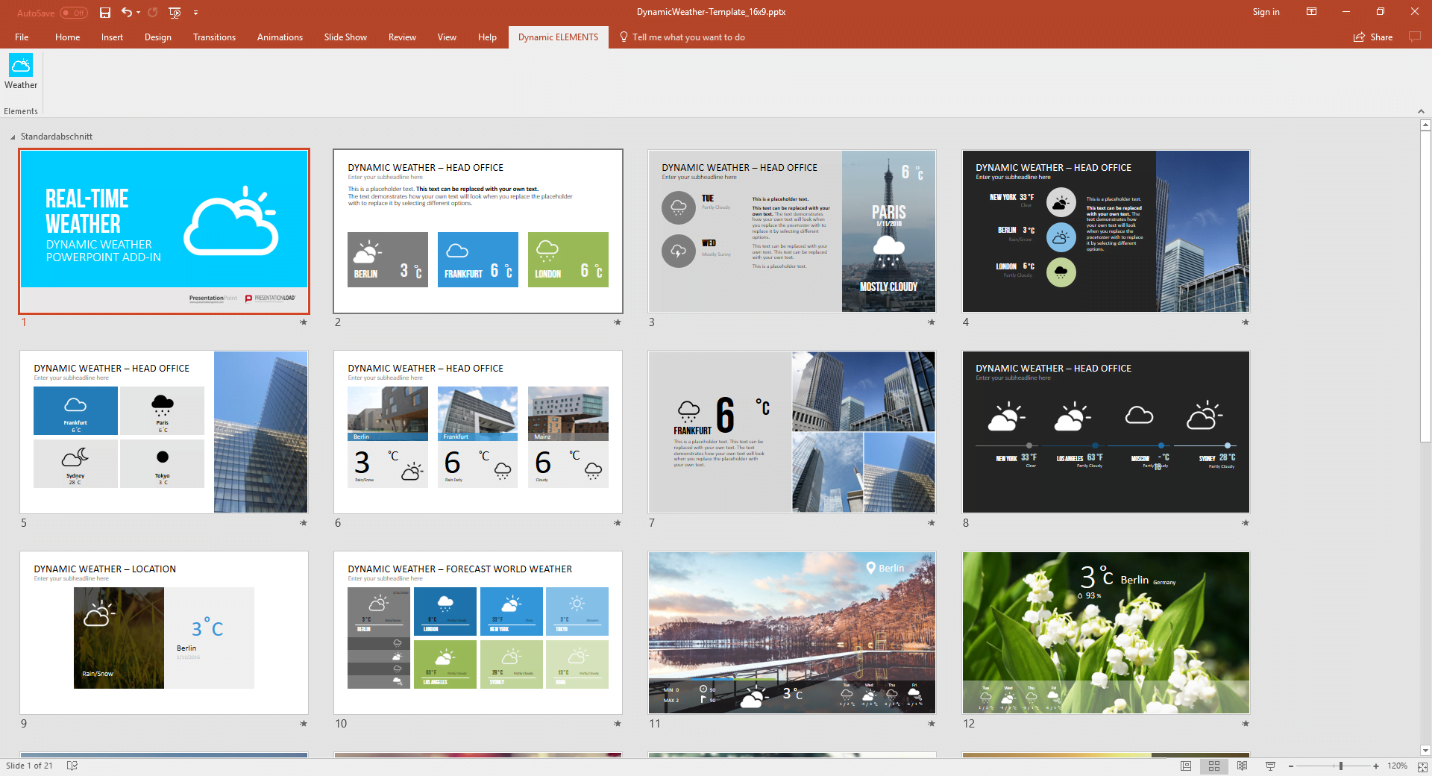
You can start using a slide that you like and change it accordingly to your needs.
And this slide in the slideshow looks like this.